📸 App Screenshots & Feature Visuals
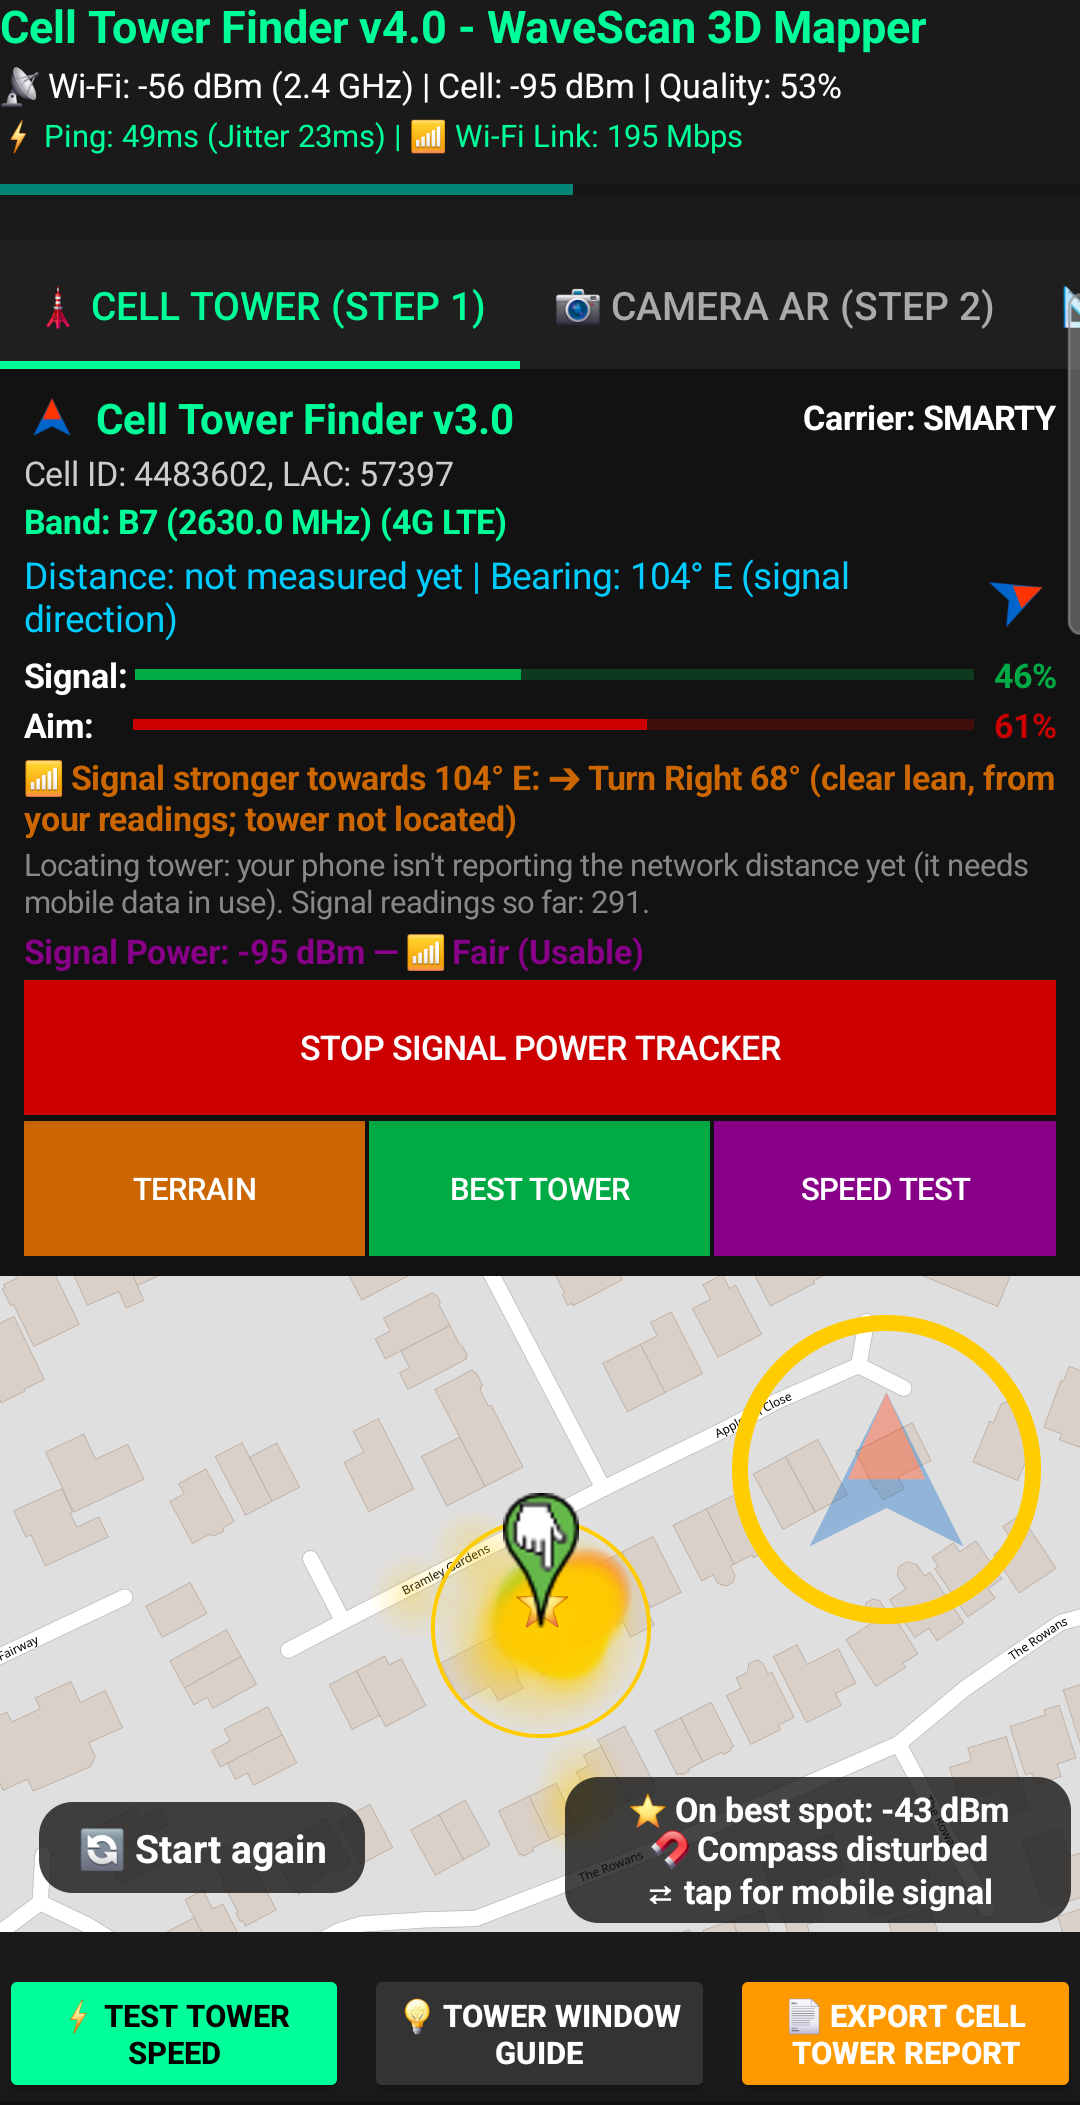
Step 1: Cell Tower Map
Live Signal Heatmap, ⭐ Strong Spot & Compass
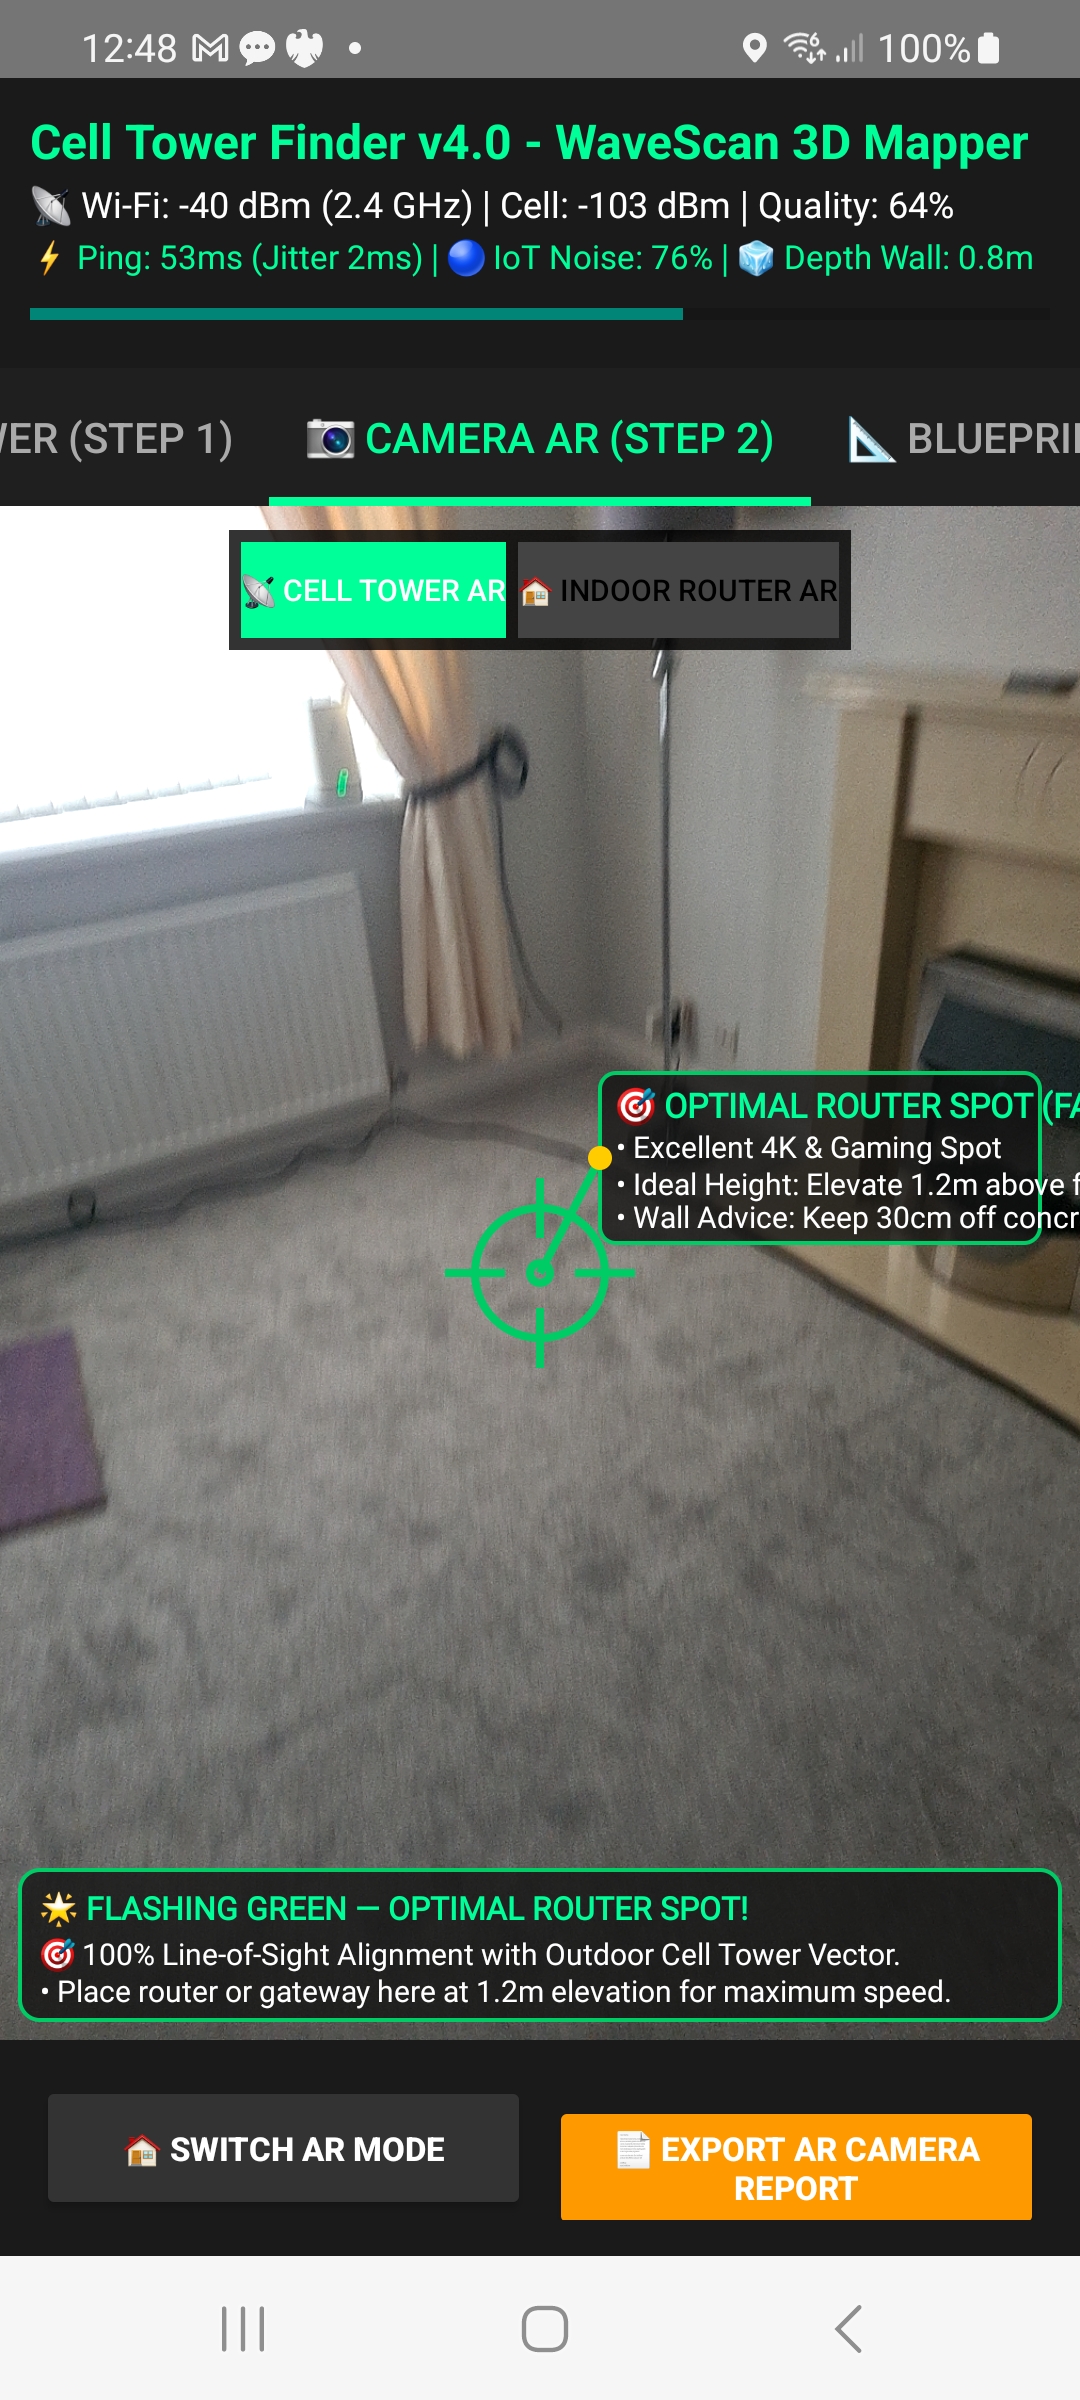
Step 2: AR Camera
Live Wi-Fi Crosshairs & Router Anchor Box
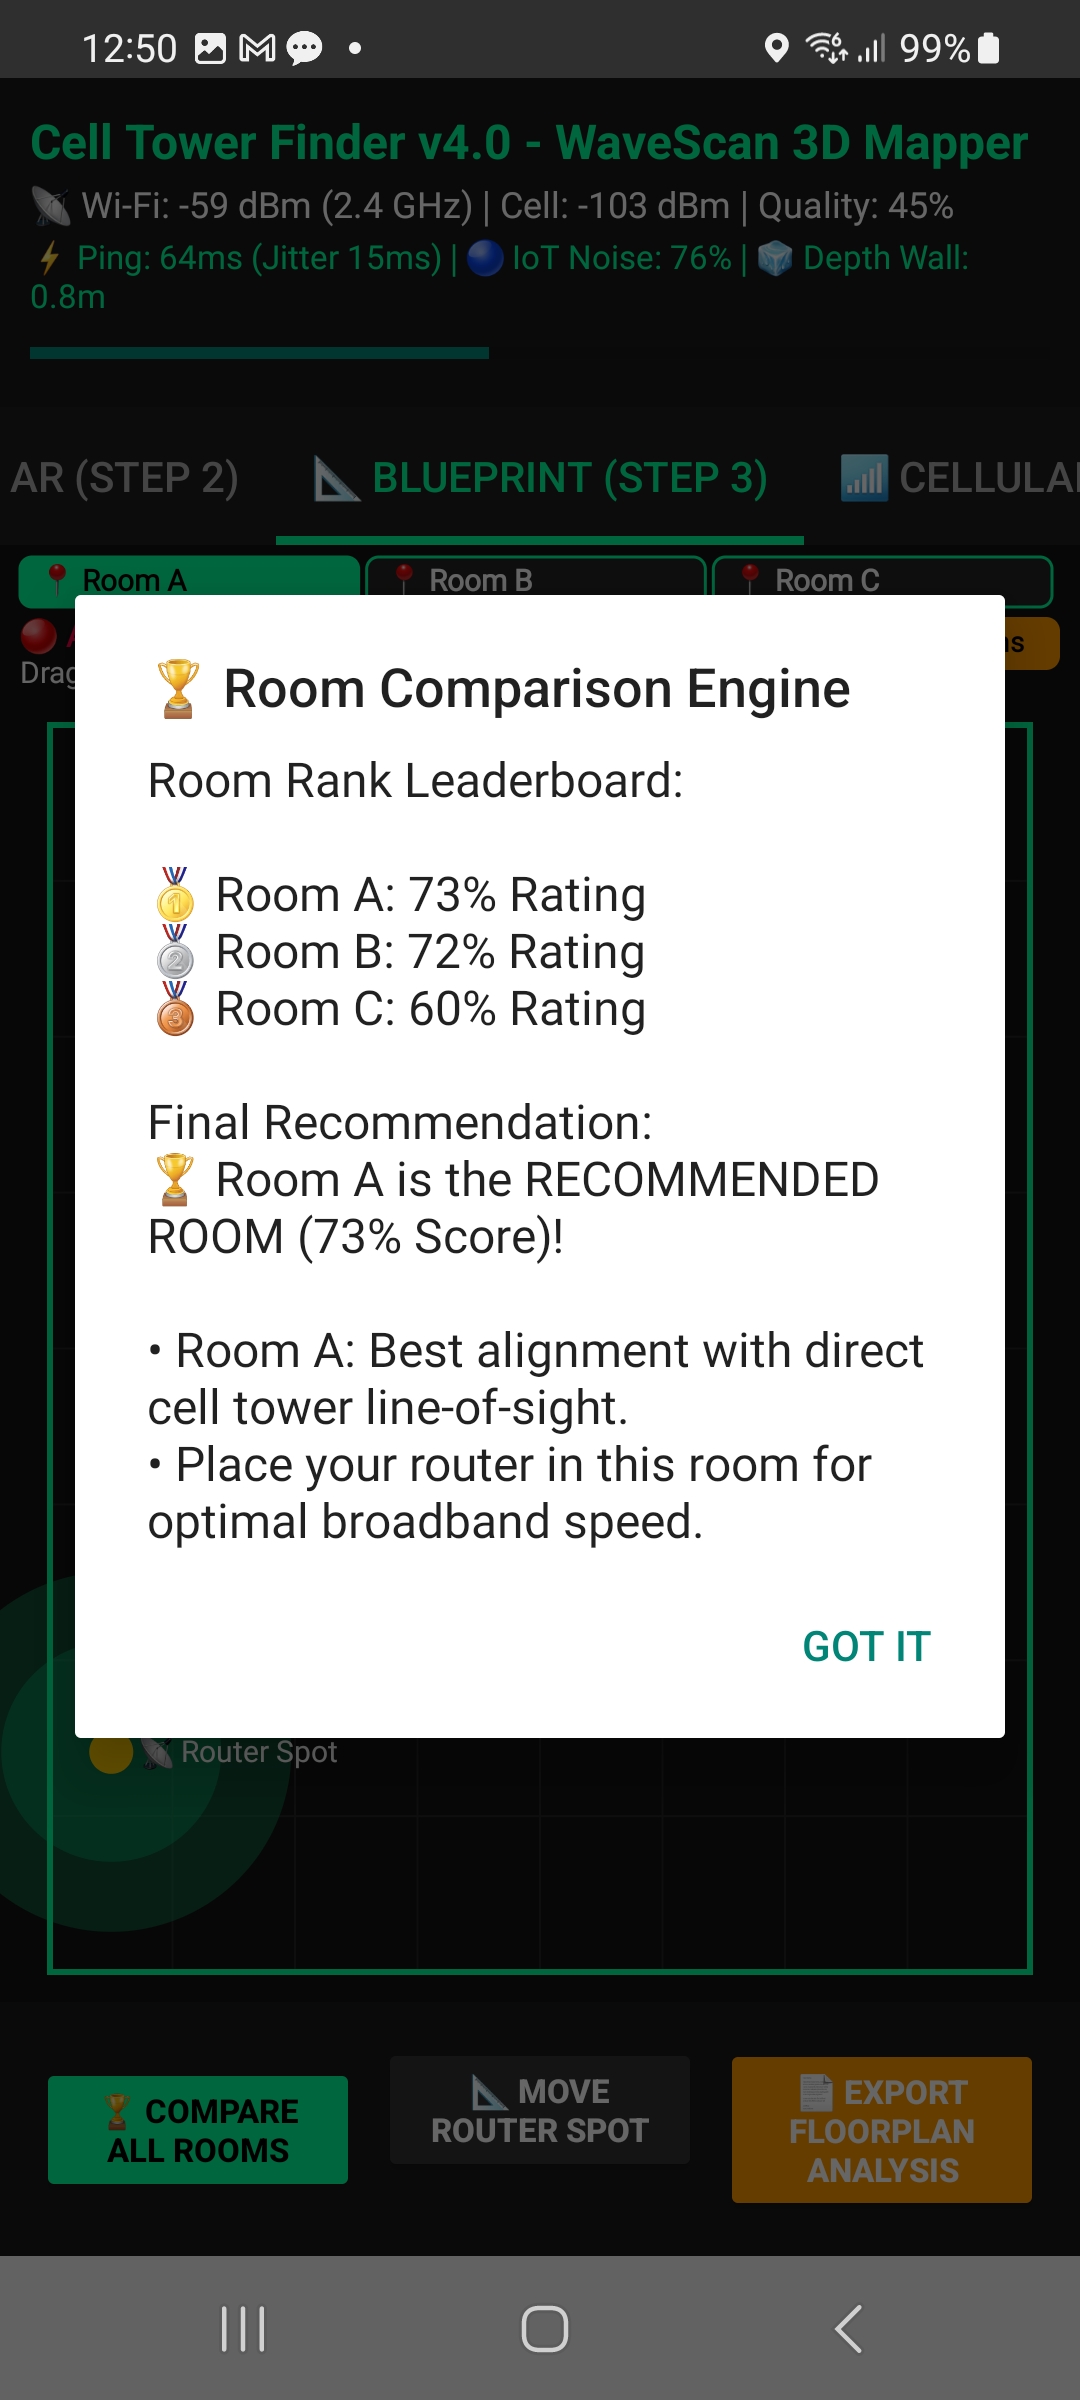
Step 3: Blueprint
Floorplan Modeler & Room Leaderboard
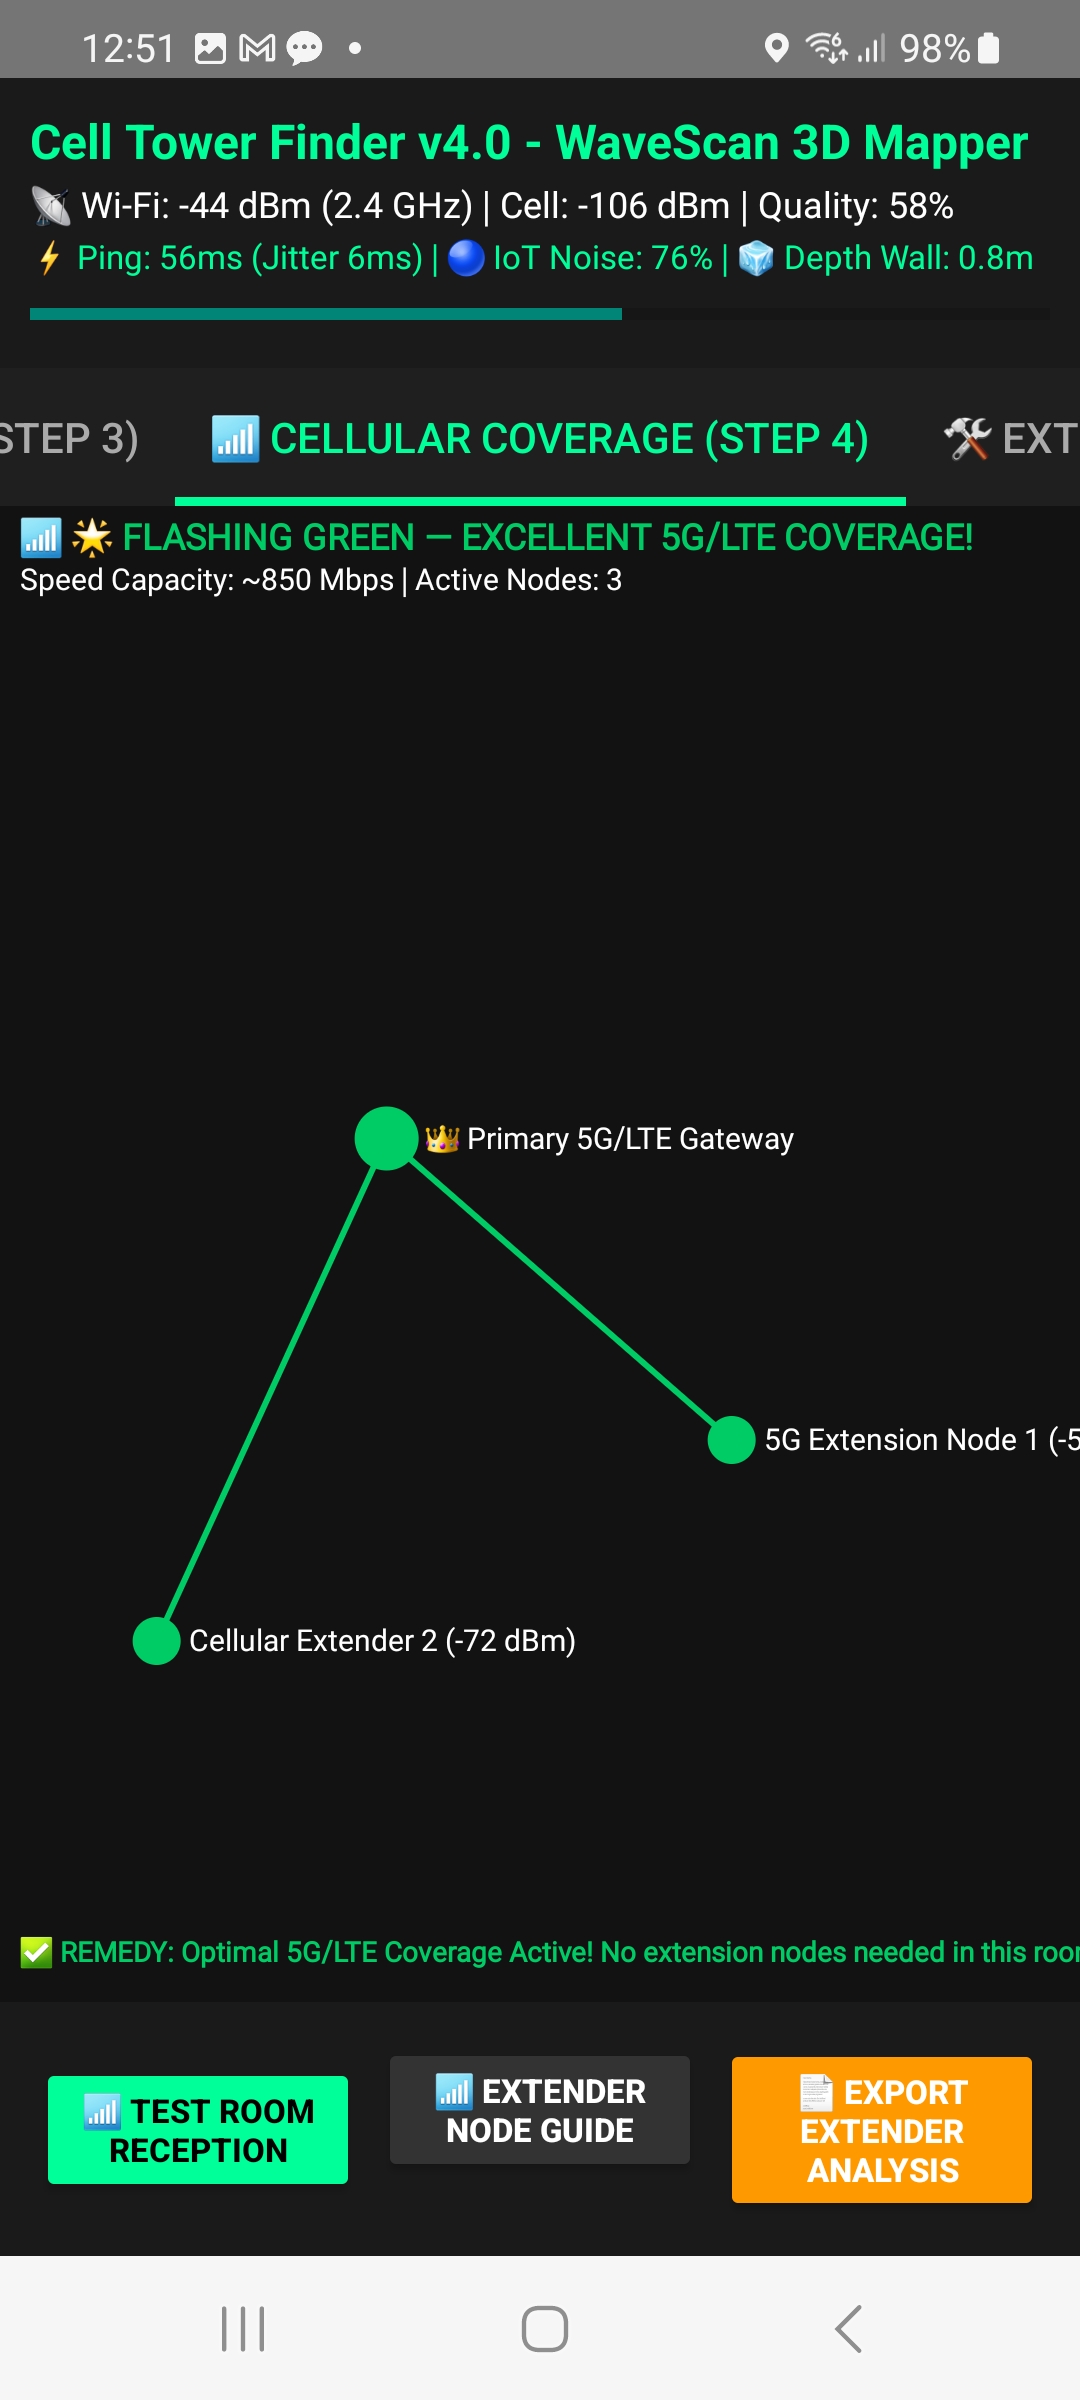
Step 4: Reception Scanner
Live Signal Scanner & Dead-Zone Alert
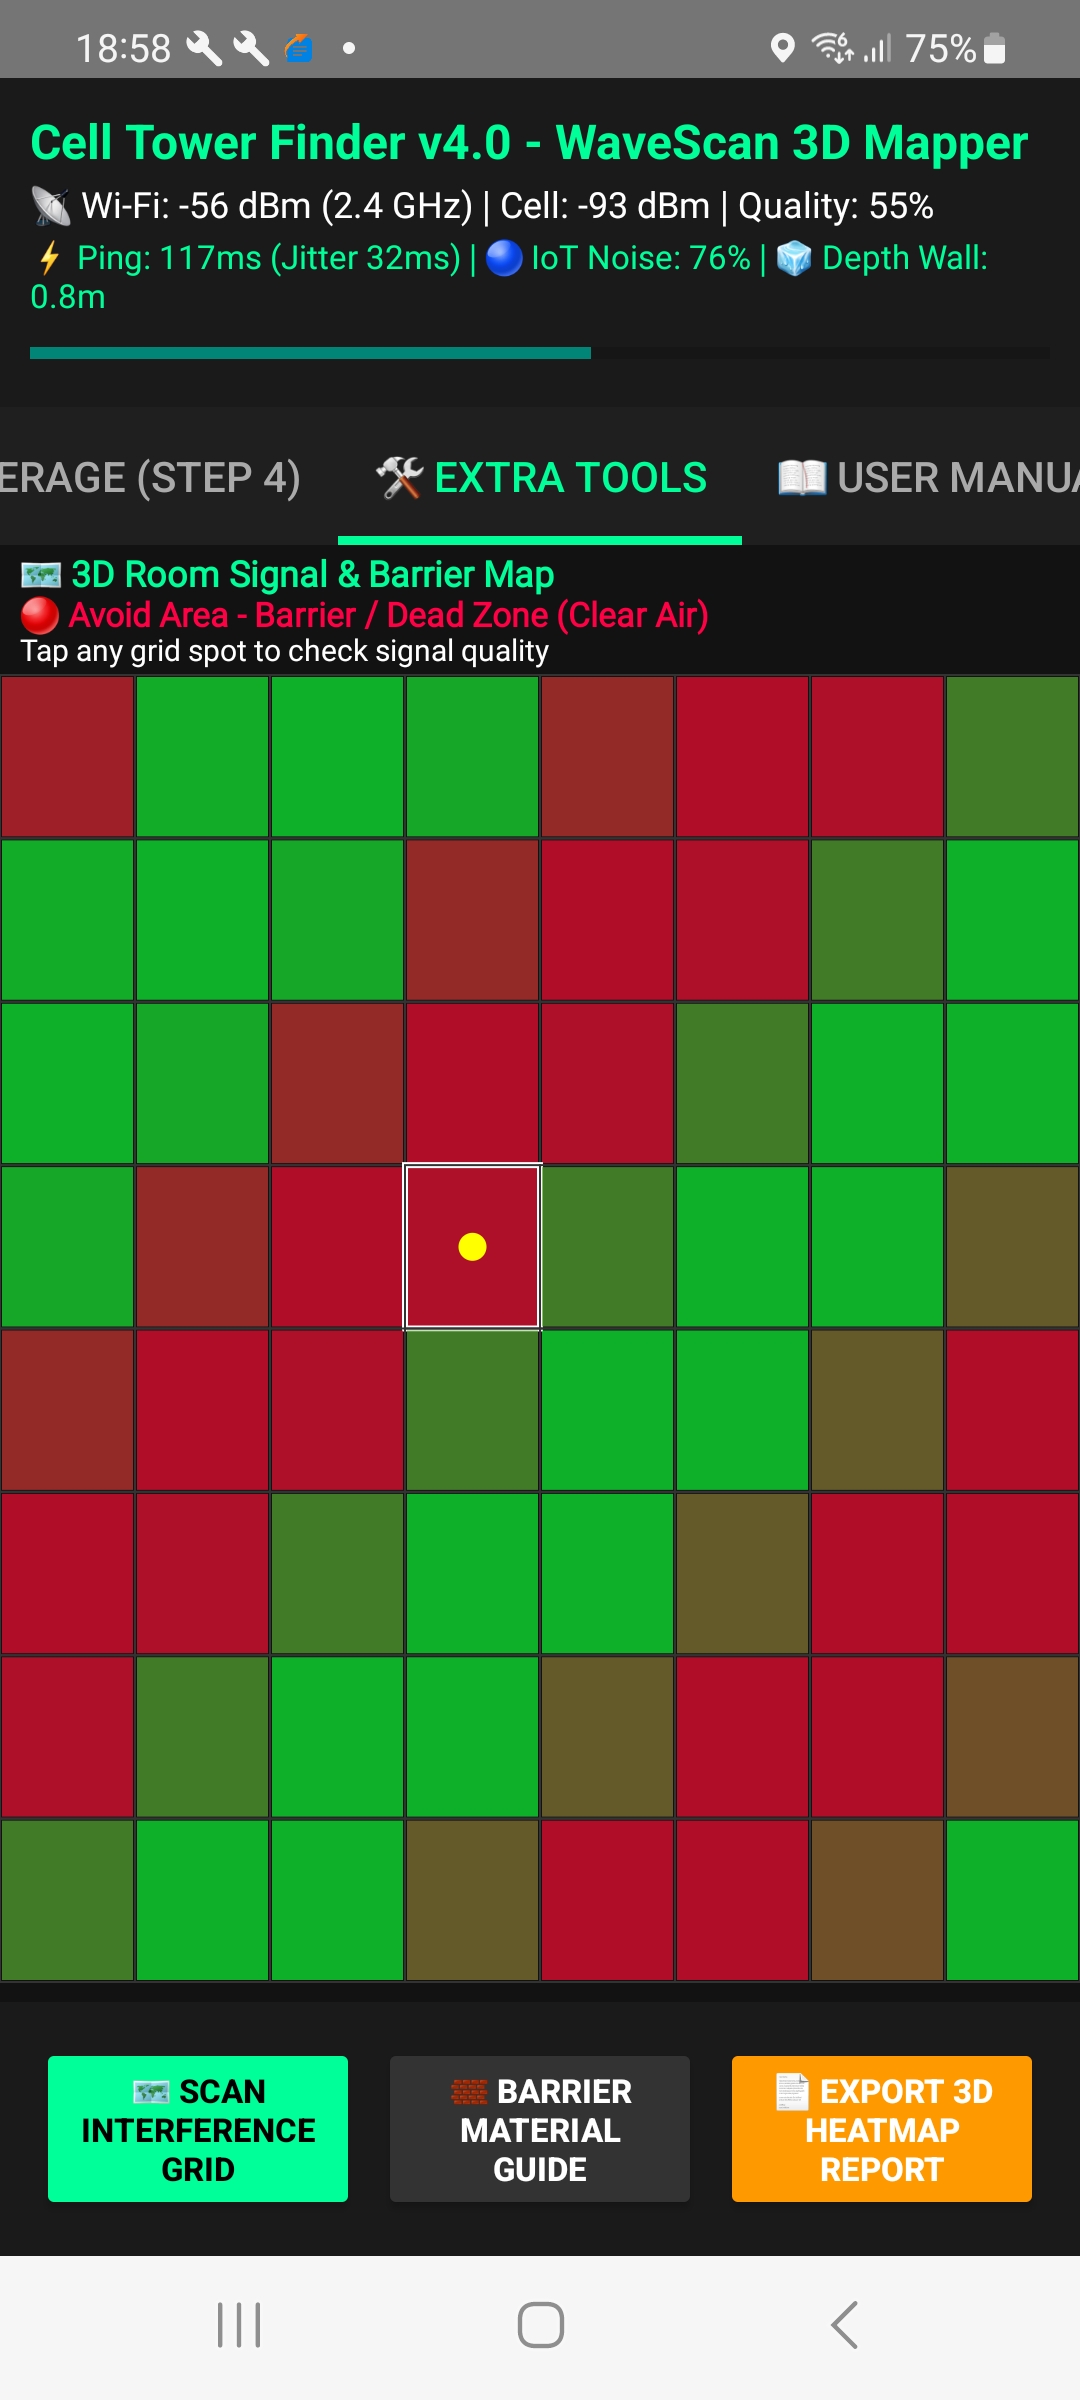
3D Heatmap Matrix
RF Barrier Material Attenuation Grid
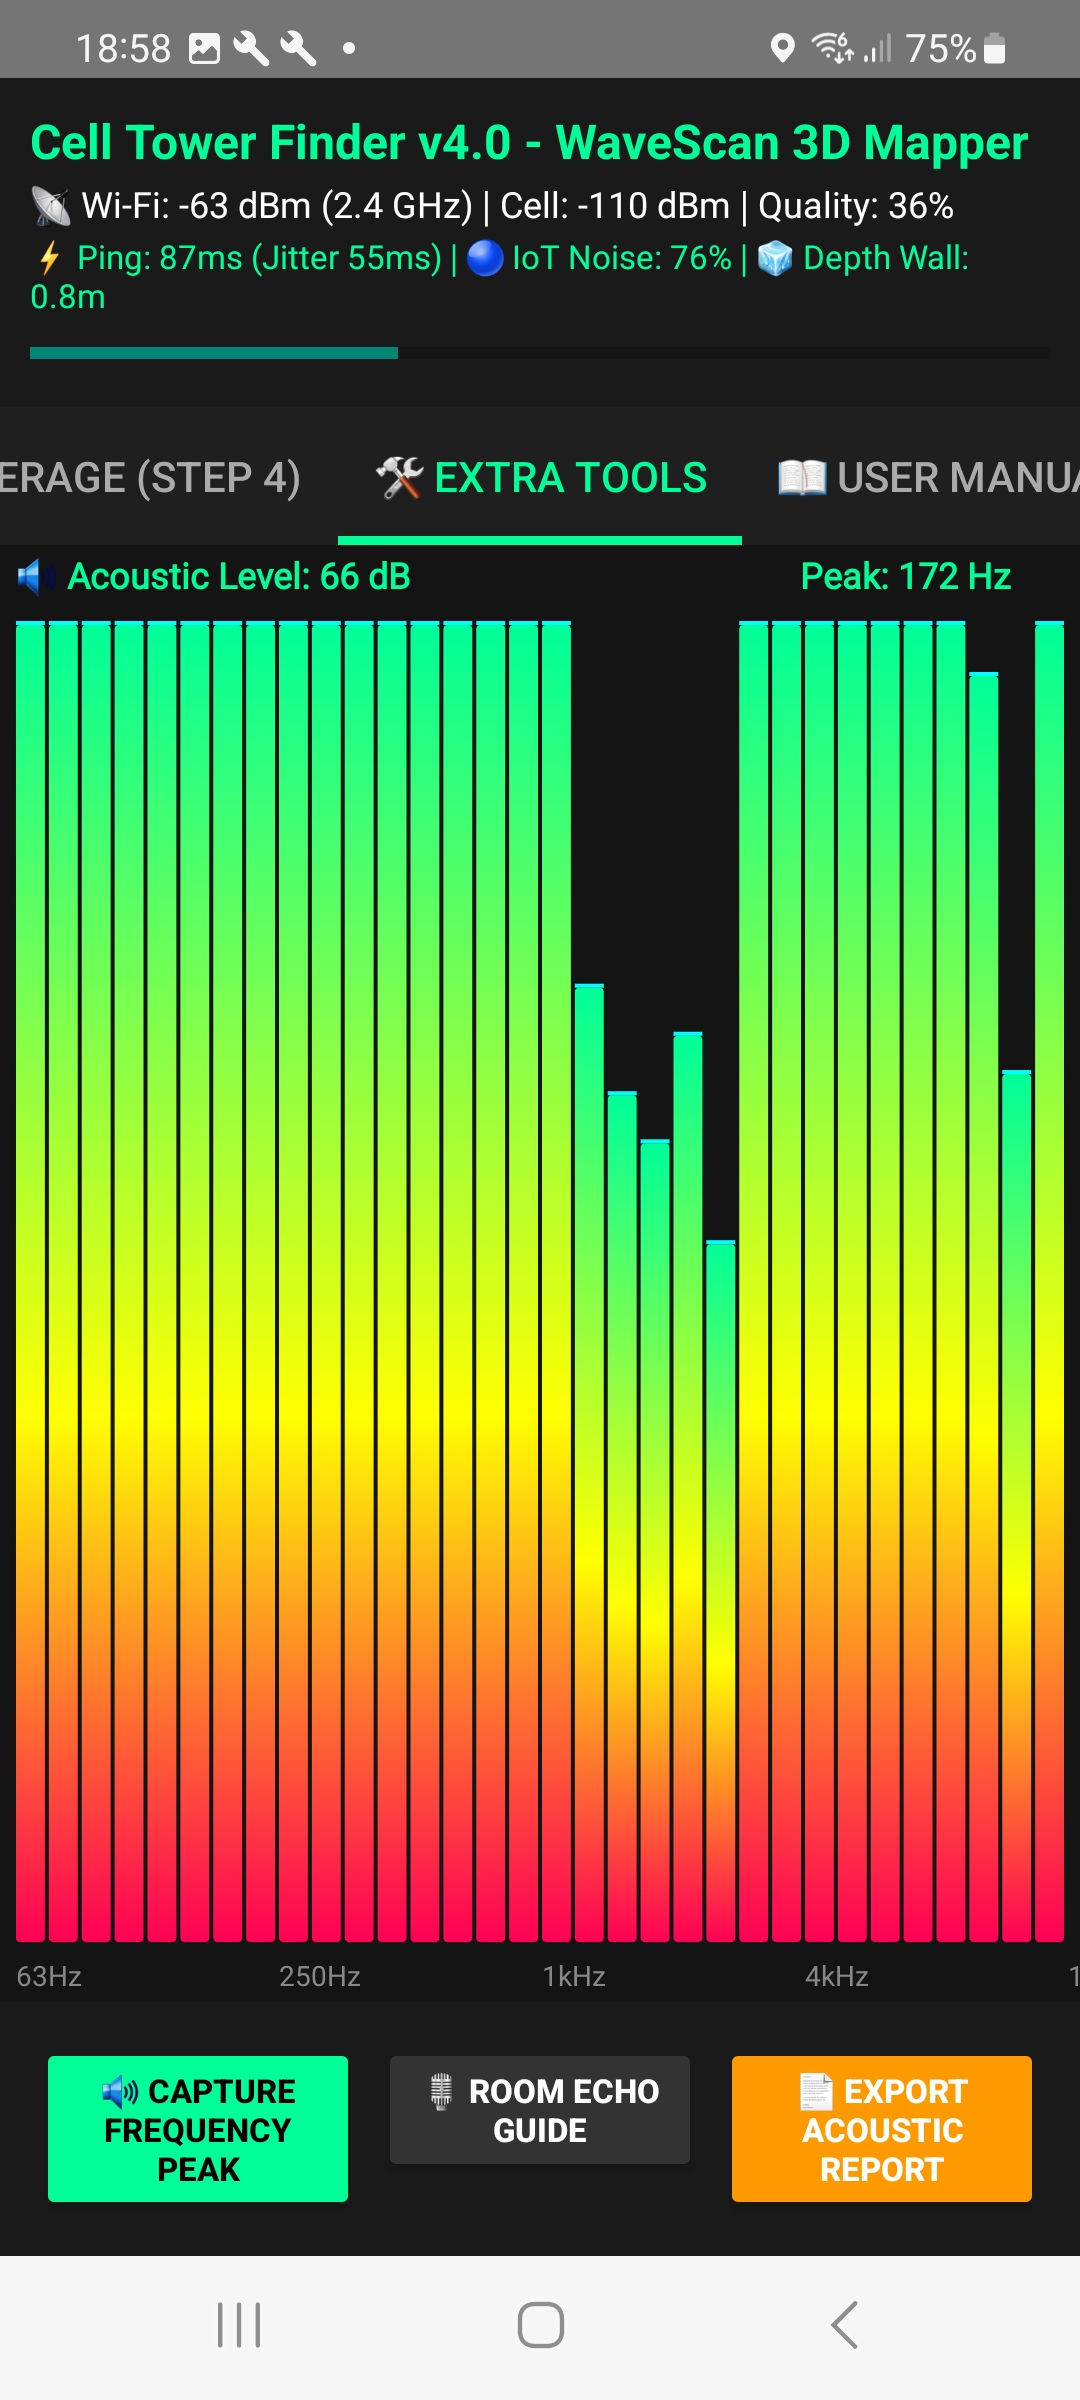
32-Band FFT Spectrum
Real-Time Acoustic Echo Resonance
🏆 How Cell Tower Finder v4.0 Crushes the Competition
| Feature / Capability | Cell Tower Finder v4.0 | Basic Compass / Cell Apps |
|---|---|---|
| Signal-Direction Aim | ✔ Aim bar turns GREEN within ±10° of your measured signal direction | ✖ Jumpers & static needle compasses |
| Camera AR Overlays | ✔ Live Wi-Fi crosshairs (Coverage score) & 1.2m Elevation Anchor | ✖ 2D static camera overlays only |
| Indoor Multi-Room Suite | ✔ Drag & drop Blueprint Modeler & Leaderboard | ✖ Single point speed test only |
| Coverage Dead-Zone Scanner | ✔ Green / Flashing Green / Amber / Red + Weak Signal Simulation | ✖ Basic RSSI bar indicator |
| Where the Data Comes From | ✔ Your own live readings, no crowd-sourced tower maps | ✖ Often rely on crowd-sourced tower databases |
| RF Barrier Matrix | ✔ Material Attenuation (Concrete, Glass, Foil, Rebar) | ✖ Not available |
| 32-Band FFT Acoustic Spectrum | ✔ 20 Hz - 20 kHz resonance echo detector | ✖ Not available |
| Data Privacy | ✔ Readings stored only on your phone (never sent to a tower database) | ✖ Many send readings to online databases |
📖 Official Step-by-Step Field Guide & User Manual
(100% Word-for-Word identical to the in-app Field Guide in Cell Tower Finder v4.0)
ℹ️ HOW THIS APP WORKS
Cell Tower Finder doesn't rely on crowd-sourced tower databases, which can be approximate or out of date. It works from what your own phone measures right now: your live signal strength, the cell you're connected to, the network's distance measurement when your phone reports it, and GPS.
Walk around your home, front and back. The app shows which way your signal gets stronger and marks a ⭐ strong spot. It places the tower once your readings allow. Walls and reflections can affect the direction, and the app always tells you when the tower isn't located yet.
🌟 PART 1: FREE EDITION WORKFLOW (STEPS 1 & 2)
• Step 1 (🗼 Cell Tower Map - Outdoor Alignment):
- Open the app and tap the '🗼 Cell Tower' tab. Allow location: Android requires precise location before apps can read cell details.
- The map opens zoomed in on your home. Walk slowly around the house and garden: every reading your phone takes becomes a coloured circle on the map (🟢 strong, 🟡 fair, 🔴 weak), building a live signal heatmap (EXPERIMENTAL: GPS indoors is only accurate to about 5-15 m, so treat it as a guide). The circle where you stand pulses with the live signal.
- ⭐ marks a strong spot measured so far, and the big compass on the map points to it. Its ring shows the signal where you are standing, in the same colour as the pulsing circle on the map. On Wi-Fi it uses the same colours as 📶 Coverage: GREEN = excellent (-55 dBm or better), AMBER = good (down to -70 dBm), RED = weak, grey = not connected. On mobile signal it follows your phone's own signal bars (the same as its status-bar icon): GREEN = 4 bars, LIME = 3, ORANGE = 2, RED = 0-1. When you are within GPS accuracy of the ⭐ (about 10-20 m indoors) the label says '⭐ On strong spot' and the arrow is held still and dimmed, because there the direction is only GPS noise. The ⭐ only moves to a new spot when that spot is clearly stronger (3 dB or more), so it doesn't jump with every reading. The compass works held flat, tilted towards you or upright. If the label shows '🧲 Compass disturbed', move away from metal, appliances or speakers; '🧭 Calibrate' means move the phone in a figure-8. Walking steadily outdoors with the phone pointing the way you walk lets the app measure and remove the compass error from your GPS direction of travel. The small pointer arrow at the top points to the cell tower once it's located. Until then, once you have walked around the outside of your home, front and back, it points the way your mobile signal gets stronger ('📶 Signal stronger towards…', EXPERIMENTAL: worked out from your own readings; usually the side facing the tower, but walls and reflections can mislead it, so it is a signal direction, not a located tower). It stays greyed out (Aim '—') until your readings show a real lean: each 3 m spot counts once, however long you stand there, so a few steps in a small garden are usually not enough; readings from different sides of the house are needed. The 🎯 Aim bar under the Signal bar fills up as you turn to face the pointer's target: 100% facing it, red when facing away, amber when close, GREEN when locked on (within ±10°). The Aim bar shows your aim, not signal strength; the Signal bar above it shows your phone's own signal bars (0-4). The Line-of-Sight line shows '➔ Turn Right X°' / '⬅ Turn Left X°'. The ⭐ spot is a good place for your phone or 5G/4G router. The ⭐ is a place to walk to, not the direction of the tower. 💡 Tip: the ring helps indoors: its colour shows how good the signal is in the room you're in. The arrow helps outdoors: once you're further from the ⭐ than GPS can resolve (about 10-20 m), it points the way to it. Indoors you're usually within that, so it shows '⭐ On strong spot'.
Tap the label under the big compass to switch the heatmap between mobile signal and Wi-Fi (each keeps its own readings). In Wi-Fi mode the ⭐ marks a strong Wi-Fi spot, usually towards your router. To start a fresh walk, tap '🔄 Start again' at the bottom of the map (it clears your readings for the heatmap you are viewing). - Signal and distance on this screen come straight from your phone and network. The Signal bar and the 'Signal Power' line show the measured dBm and your phone's own signal bars, the same as its status bar (e.g. '📶 Moderate (phone: 2/4 bars)'). Cell tower: the network tells your phone how far away the tower is (timing advance, while mobile data is in use). This shows as 'Distance: ≈…m (network-measured)' and a dashed ring on the map: the tower is on that ring. Walk around your home and garden: the app keeps measuring, and once it has readings from far enough apart (for example with the app open on a walk down your road) it works out where the tower is ('located from your readings') and draws the line to it. The network-measured distance is still shown first; the located position gives the bearing (estimated).
- Speed & Terrain Test: tap '⚡ Test Tower Speed' at the bottom for a real download/upload test (about 30 MB of data maximum). Turn Wi-Fi off to test the mobile tower itself. 'Terrain' shows the path loss and Fresnel zone calculated from the distance (network-measured when available) and the frequency (the app has no terrain or building data). 'Best Tower' lists the cells your phone can hear.
• Step 2 (📷 Camera AR - Indoor Router AR Placement Mode):
- Tap '📷 Camera AR' and allow the camera when asked. The Indoor Router AR view opens.
- Point your camera around the room and move slowly from spot to spot. The crosshairs follow your live Wi-Fi signal, rated with the same Coverage score as 📶 Cellular Coverage; the anchor box shows it, e.g. '• From Wi-Fi -59 dBm: score 68%'. Indoors the app uses Wi-Fi only: mobile signal is hard to pinpoint room by room, while Wi-Fi changes clearly from spot to spot. If Wi-Fi is off it shows '⚪ WI-FI NOT CONNECTED'.
- The score runs from -100 dBm or weaker (low) to -40 dBm or stronger (high), shown between 10% and 98%, so every 1 dB moves it by about 1.7%. The crosshairs FLASH GREEN at 75% or more ('🎯 OPTIMAL ROUTER SPOT!'), turn amber from 50% ('🟡 GOOD AREA - STABLE SIGNAL') and red below 50% ('🔴 WEAK SIGNAL HERE' from -71 to -80 dBm, '🔴 AVOID - WEAK SIGNAL HERE' weaker than -80 dBm). The phone updates its readings every few seconds, so give each spot a moment.
- The floating anchor box also shows 1.2m elevation and wall barrier advice. Place your router or gateway where the crosshairs flash green. '💡 Router Spot Guide' at the bottom shows these tips again.
💎 PART 2: WAVESCAN PRO INDOOR SUITE (STEPS 3 & 4)
• Step 3 (📐 Room Selection & Blueprint Modeler):
- Tap '📐 Blueprint'. Select Room A, Room B, or Room C at the top (long-press a tab to rename it or add rooms).
- Walk to that room. Touch and drag the Yellow Router Icon (📡) to where you're standing and let go: a real Wi-Fi reading is recorded for that room (Wi-Fi must be connected). Take at least 3 readings per room.
- The header shows the room's rating with the same Coverage score as 📶 Coverage, from its median Wi-Fi reading: 🟢 Excellent (75% or more), 🟡 Good (50% or more), 🔴 Weak (below 50%, -71 to -80 dBm) or 🔴 Avoid (weaker than -80 dBm). With only one room measured there's nothing to compare yet.
- Tap '🏆 Compare All Rooms' to view the leaderboard. Rooms are ranked by their median Wi-Fi reading and its Coverage score; rooms with no readings are listed as not measured. If the top rooms are within 2 dB of each other, it says they are too close to call (readings vary by a couple of dB on their own).
- Physical Motion Warning: if you switch room tabs without walking (< 3m moved, from GPS), a warning reminds you to walk to that room for an accurate reading. It relies on GPS, which indoors can be out by 5-15 m or more, so it may not always appear, and it can appear when you didn't mean to switch rooms.
• Step 4 (📶 Cellular Signal Coverage & Extension Map):
- Tap '📶 Cellular Coverage'. Walk to the room or space furthest from your primary router.
- The diagram and colours follow your live Wi-Fi reading; the line under the heading shows it, e.g. 'From Wi-Fi -59 dBm (68%)'. Green at a 75% score or more (-55 dBm or better), amber from 50% (down to -70 dBm), red below. If Wi-Fi is off it shows 'WI-FI NOT CONNECTED'. Tap '📶 Test Room Reception' for the diagnosis:
- Green = Strong Signal (75-89% score): '🟢 STRONG SIGNAL (No extension nodes needed)'; the screen shows '🟢 GREEN — STRONG SIGNAL'.
- Flashing Green = Excellent (90% or more, -46 dBm or better, usually right next to your router): '🔥 EXCELLENT SIGNAL (No extension nodes needed)'; the screen FLASHES green with the background pulsing and shows '🌟 FLASHING GREEN — EXCELLENT SIGNAL!'.
- Amber: '⚡ GOOD RECEPTION (Move router 30cm closer to window)'.
- Red, -71 to -80 dBm: '⚠️ WEAK SIGNAL. A WI-FI EXTENDER / MESH NODE MAY HELP HERE.'
- Red, weaker than -80 dBm: '⚠️ WEAK SIGNAL DEAD-ZONE! FITMENT OF A WI-FI EXTENDER / MESH NODE RECOMMENDED HERE.'
- '🧪 Test Weak Signal' shows what the dead-zone display looks like (-95 dBm simulation, clearly labelled); switch back to live afterwards.
- '📶 Extender Node Guide': place the extension node about halfway between your router and the dead-zone.
🛠 PART 3: EXTRA TOOLS (ADVANCED PRO DIAGNOSTICS)
Tap '🛠 Extra Tools' on the top menu bar:
1. 🗺 3D Room Heatmap Matrix (EXPERIMENTAL):
- How to Use: tap the grid square you're standing on, then '🗺 Scan Interference Grid' to record a real Wi-Fi reading there (Wi-Fi must be connected). Repeat across the room.
- Grid Colour Scale: the same Coverage score as 📶 Coverage: green 75% or more, amber 50% or more, red below. Squares you haven't measured show animated colours for display only (not readings). The yellow dot marks a strong square.
- '🧱 Barrier Material Guide' lists typical published losses (concrete, foil insulation, glass…).
2. 🔊 32-Band FFT Microphone Spectrum Analyzer:
- Real-time microphone analysis across 32 frequency bands. Shows the peak resonance (Hz) and the sound level relative to the microphone's maximum (phone microphones aren't calibrated sound meters).
- The microphone is only used while this screen is open.
📄 PART 4: EXPORTING REPORTS & PRO SUITE UNLOCK
- Tap 'Export Report' on the bottom action bar to generate and share PDF or JSON field reports of your measurements (Pro).
- Pro is one payment for life through Google Play, with no subscription. The price is shown by Google Play at checkout. Purchases are restored automatically on reinstall. If you subscribed before, you can manage or cancel it in Google Play › Payments & subscriptions.
📊 PART 5: DBM SIGNAL STRENGTH REFERENCE GUIDE
4G/5G RSRP:
- -80 dBm or better: 🟢 EXCELLENT SIGNAL (Maximum throughput & minimal latency)
- -80 to -90 dBm: 🟡 GOOD SIGNAL (Stable streaming, low buffering)
- -90 to -100 dBm: 🟠 FAIR SIGNAL (Position antenna closer to window)
- Below -100 dBm: 🔴 POOR / DEAD ZONE (External antenna, booster or Wi-Fi Calling recommended)
Wi-Fi (the Coverage score used everywhere in the app): -55 dBm or better 🟢 EXCELLENT (75% or more), down to -70 dBm 🟡 GOOD (50% or more), below -70 dBm 🔴 WEAK (a Wi-Fi extender or mesh node may help).
How the app uses these:
- 🗼 Cell Tower (Step 1): mobile signal straight from your phone: the measured dBm, your phone's own signal bars (0-4, the same as its status bar) and the network-measured distance. The bands above are a general guide.
- Indoors (📷 Camera AR, 📶 Coverage, 📐 Blueprint and the 🗺 Heatmap): Wi-Fi only, with the Coverage score: -100 dBm or weaker = 10%, -40 dBm or stronger = 98%; green 75% or more (-55 dBm or better), amber 50% or more (down to -70 dBm), red below. Mobile signal is hard to pinpoint room by room, while Wi-Fi changes clearly from spot to spot.
⚠️ IMPORTANT DISCLAIMER - SIGNAL DISCREPANCIES FAQ
While the incoming radio waves are the same, the hardware and software on the phone change how that data is interpreted.
1. Signal Quality Differences (The Hardware Factor):
The exact same cell tower can read completely differently on two different brands sitting side by side due to the physical components inside:
- The Modem and Antenna: Premium brands use high-end modems paired with precisely engineered antenna bands woven into the phone's frame. Budget brands often use alternative modems and less efficient internal antennas. This means a premium phone might maintain a clean, strong connection, while a budget phone sees a degraded, noisy signal from the exact same tower.
- Signal Smoothing (Software): What you see on your screen is heavily manipulated by software. Some manufacturers apply aggressive software filtering to smooth out signal drops so the user doesn't see their signal bars wildly jumping around. One brand might report a signal as stable but weak, while another reports it as highly volatile.
2. Bearing and Directional Data:
- The phone doesn't know the direction of the tower by itself; it only knows it is receiving a signal. This app locates the tower from your own readings (network-measured distance and signal at different spots) combined with GPS and the phone's compass. Without a tower position it can show the direction your signal gets stronger, measured from your readings; this is a guide, not the tower's exact direction.
- GPS indoors is accurate to roughly 5-15 m, so the heatmap shows which side or end of the house is best rather than which shelf. For room-by-room comparison use 📐 Blueprint.
- The Sensor Calibration Issue: high-end phones continuously calibrate their compasses; others may drift. Metal, cars and appliances also disturb compasses. If the compass seems wrong, move the phone in a figure-8 away from metal.
Please use the features and various metrics provided in this app as a collective guide only.
⚖️ THIRD-PARTY SERVICES & DISCLAIMER
- Signal readings, the heatmap and tower positions are measured and stored only on your phone; no cell or location data is sent to any tower database.
- Maps are provided by OpenStreetMap (© OpenStreetMap contributors). Speed tests use Cloudflare's public speed-test service. Neither is affiliated with this app.
- The signal heatmaps (Cell Tower map and 3D Room Heatmap Matrix) and the signal direction are experimental features. They show real readings from your phone and are a visual guide only, not a professional site survey.
- Measurements and calculations are provided for guidance only, without warranty. Your mobile network operator is the authority on its own network and coverage.
ℹ️ ABOUT & APP INFO (VERSION 2.7)
- App Name: Cell Tower Finder v4.0 (WaveScan Pro)
- Version: 2.7 (Build 18)
- Target SDK: Android 36 (Edge-to-Edge & Full Debug Symbols)
- Core Modules: Outdoor Cell Tower Azimuth Alignment, Indoor Router AR Camera Overlay, Indoor Blueprint Modeler, Cellular Coverage & Extension Map, Room Heatmap Matrix and 32-Band Acoustic Spectrum Analyzer.
- Maps © OpenStreetMap contributors.
- Publisher: Appstack Studio
- Support: Support through developer website